 Activity in the residential real estate market remained strong in the second quarter of 2026, and we maintained the sales pace achieved in the first half of the year. During the quarter, we signed 57 sales contracts (contracts under the law of obligations; Q2 2025: 31; Q1 2026: 54), including 3 in Berlin. Most new contracts came from the Iseära, Luuslangi and Olemuse projects. Over the first six months, we signed 111 sales contracts, nearly twice as many as a year earlier (6 months 2025: 56).
The growth trend in the weekly sales ratio, that began in the first quarter of 2026, strengthened further in the second quarter. The ratio exceeded the long-term range of 1.5–2.0%, reaching nearly 3.1% as a four-week average, driven by presales of Regati phase II, the new phase of Iseära and Kadakadabra phase I. The quarterly average (~2.4%) exceeded the first-quarter level (~1.5%), confirming the recovery in demand. The ratio is influenced by project sales and supply cycles. According to Citify.eu, Liven’s market share in Greater Tallinn was over 8%during the six months of 2026.
Sales contracts signed during the period that are not transferred under a real right contract within the same period are recognised as presales. As of the beginning of the quarter, the estimated monetary value of previously recognised presales was EUR 39.7 million, of which EUR 35.0 million was in projects planned for completion during 2026.
During the quarter, we signed new contracts in the sales revenue volume of EUR 13.2 million, and presales from new sales made during the quarter amounted to EUR 10.9 million. This includes construction to be completed in both 2026 and 2027. We enter the third quarter of 2026 with 171 contracts under the law of obligations and a presale volume of EUR 48.6 million, of which 161 contracts under the law of obligations and a sales revenue volume of EUR 39.8 million are in buildings to be completed during 2026. Presales do not include Phase I of the Peakorter project, as the 50/50 joint venture results are not consolidated line by line and its sales revenue is not reflected in the consolidated results.
Over the six months, we have signed new sales contracts in a total sales revenue volume of EUR 26.2 million, of which EUR 21.3 million was recognised as presales. The presale portfolio has grown by EUR
14.9 million since the beginning of the year (at the beginning of 2026: EUR 33.7 million).
There were no new completions in the second quarter and we handed over only 12 previously completed homes (Q2 2025: 35; Q1 2026: 14). Of these, 9 were in Regati, 2 in Luuslangi and 1 in a terraced house in Iseära.
Revenue for the second quarter of 2026 was EUR 4,503 thousand (Q2 2025: EUR 7,388 thousand; Q1 2026: EUR 6,937 thousand) and profit before income tax was EUR -234 thousand (Q2 2025: EUR 1,002 thousand; Q1 2026: EUR 420 thousand).
During the first six months of the year, we have handed over a total of 26 homes and commercial units (6 months 2025: 41), earned revenue of EUR 11,439 thousand (6 months 2025: EUR 9,319 thousand) and profit before income tax of EUR 186 thousand (6 months 2025: profit before income tax of EUR 296 thousand).
The second quarter result was affected by one-off costs related to the public offering of shares. Distribution costs and administrative expenses include approximately EUR 90 thousand of costs related to the offering that were not recognised as a reduction of share premium. In connection with the dividends paid during the quarter, the income tax expense for the second quarter was EUR 384 thousand, the net loss for the quarter EUR 618 thousand and the net loss for the half-year EUR 198 thousand (Q2 2025: income tax expense of EUR 28 thousand, net profit of EUR 974 thousand and net profit of EUR 268 thousand for the six months).
Consolidated statement of financial position
| (in thousands of euros) | 30 June 2026 | 31 December 2025 | 30 June 2025 |
| Current assets | | | |
| Cash and cash equivalents | 10,033 | 8,553 | 9,574 |
| Trade and other receivables | 632 | 1,456 | 1,438 |
| Prepayments | 618 | 531 | 355 |
| Inventories | 80,015 | 71,009 | 80,342 |
| Total current assets | 91,298 | 81,549 | 91,708 |
| Non-current assets | | | |
| Trade and other receivables | 1,636 | 1,535 | 0 |
| Prepayments | 49 | 44 | 44 |
| Investment properties | 5,950 | 1,960 | 1,960 |
| Property, plant and equipment | 241 | 296 | 342 |
| Intangible assets | 456 | 467 | 439 |
| Right-of-use assets | 556 | 606 | 656 |
| Total non-current assets | 8,887 | 4,908 | 3,441 |
| | | |
| TOTAL ASSETS | 100,186 | 86,457 | 95,149 |
| Current liabilities | | | |
| Borrowings | 16,020 | 11,882 | 1,436 |
| Trade and other payables | 14,810 | 13,822 | 15,304 |
| Provisions | 95 | 97 | 40 |
| Total current liabilities | 30,925 | 25,801 | 16,780 |
| Non-current liabilities | | | |
| Borrowings | 41,322 | 34,850 | 58,104 |
| Trade and other payables | 1,084 | 2,065 | 1,734 |
| Provisions | 108 | 151 | 100 |
| Total non-current liabilities | 42,515 | 37,066 | 59,939 |
| Total liabilities | 73,440 | 62,866 | 76,719 |
| EQUITY | | | |
| Share capital | 1,305 | 1,200 | 1,200 |
| Share premium | 14,182 | 9,586 | 9,580 |
| Share option reserve | 27 | 262 | 339 |
| Own (treasury) shares | -3 | -4 | -7 |
| Statutory capital reserve | 120 | 120 | 120 |
| Retained earnings (prior periods) | 11,314 | 7,012 | 6,931 |
| Profit for the year | -198 | 5,414 | 268 |
| Total equity | 26,746 | 23,590 | 18,431 |
| TOTAL LIABILITIES AND EQUITY | 100,186
| 86,457 | 95,149 |
Consolidated statement of comprehensive income
| (in thousands of euros) | 2026 II quarter
(April-June) | 2025 II quarter
(April-June) | 2026 6 months
(January-June) | 2025 6 months
(January-June) |
| Revenue | 4,503 | 7,388 | 11,439 | 9,319 |
| Cost of sales | -3,785 | -5,624 | -9,353 | -7,322 |
| Gross profit | 718 | 1,764 | 2,086 | 1,997 |
| Distribution costs | -557 | -580 | -1,012 | -1,034 |
| Administrative expenses | -352 | -379 | -746 | -840 |
| Other operating income | 23 | 200 | 37 | 222 |
| Other operating expenses | -9 | 7 | -25 | -20 |
| Operating profit | –177 | 1,012 | 341 | 325 |
| Finance income | 62 | 22 | 128 | 36 |
| Finance costs | -119 | -32 | -283 | -65 |
| Total finance income and finance costs | –57 | –10 | –155 | –29 |
| Profit before tax | –234 | 1,002 | 186 | 296 |
| Income tax expense | -384 | -28 | -384 | -28 |
| Profit for the period | –618 | 974 | –198 | 268 |
| Attributable to owners of the parent | -618 | 974 | -198 | 268 |
| Comprehensive income for the period | -618 | 974 | -198 | 268 |
| Attributable to owners of the parent | -618 | 974 | -198 | 268 |
| Basic earnings per share | 0.049 | 0.081 | -0.016 | 0.022 |
| Diluted earnings per share | -0.047 | 0.080 | -0.016 | 0.022 |
Key events
The Annual General Meeting of Liven AS was held on 9 April, attended by 28 shareholders representing 93.5% of all votes. The shareholders approved the 2025 annual report and resolved to pay dividends of EUR 1,362 thousand in accordance with the dividend policy (25% of the 2025 profit before income tax). The shareholders approved the preparation of the public offering of shares and the admission of the shares to trading, excluded
existing shareholders’ pre-emptive right to subscribe for new shares, and amended the Articles of Association to extend the authority granted to the Supervisory Board to increase the share capital.
In April, the Supervisory Board decided to cancel the previous options issued for 191,850 shares with personalised targets and to replace them with new options for up to 508,500 shares. The vesting period for the new options is at least three years, the vesting targets are divided incrementally over five years and are based on the six-month average share price on the Nasdaq Tallinn Stock Exchange, ranging from EUR 8.95 to EUR 10.64.
In order to acquire new development properties and to strengthen the capital structure, we carried out the initial public offering of Liven AS shares in the period from 23 April to 7 May 2026, and since 15 May 2026 all Liven shares have been trading on the Baltic Main List of the Nasdaq Tallinn Stock Exchange. During the offering, more than 2,000 investors subscribed for a total of 1,053,936 new shares at a price of EUR 4.68 per share, in a total volume of EUR 4,932 thousand, with 95% of the investors from Estonia.
In June, the Supervisory Board extended the authority of Management Board member Alina Kester until 3 June 2029.
During the quarter, we expanded the Berlin development portfolio with two new properties. In May, Liven P19 GmbH signed a notarial contract for the acquisition of the property at Plantagenstraße 19 in the Steglitz district (transaction volume EUR 1.7 million, total project investment over EUR 11 million). In June, Liven R101 GmbH signed a contract for the acquisition of the property at Reichstraße 101 in the Westend district (EUR 1.2 million, total investment approximately EUR 8 million). A residential building with nearly 20 homes is planned for each property, with construction scheduled to start at the end of 2027 and the beginning of 2028, respectively.
During the quarter, we launched presales in three projects. In the Regati project, we started the presale of phase II homes (Regati pst 3). In Harkujärve village, we started the presale of the apartment buildings of the new phase of the Iseära project. In the Kadakadabra project (Kadaka tee 88), we started the presale of phase I homes.
Events after the reporting period
In July, the group’s subsidiary Liven Kodu 25 OÜ signed a notarial contract for the acquisition of the development properties at Pärnu maantee 35, 37 and 41 in the centre of Tallinn. The transaction volume is EUR 10 million and the estimated total project investment approximately EUR 40 million. Three residential and commercial buildings with a total of more than 160 homes are planned for the properties.
We started preparations for construction works in phase II of the Regati project, in the following phases of the Iseära project and in the Kadakadabra project.
Economic environment overview
The second quarter of 2026 continued to be characterised by the interaction of opposing factors. On the one hand, the recovery of Estonian households’ purchasing power and the slowdown in price growth; on the other hand, geopolitical uncertainty arising from the conflict in the Middle East, which put pressure on energy prices and interest rate expectations. The 6-month Euribor rose to 2.57% during the quarter (31 March 2026: 2.475%; 30 June 2025: 2.05%). According to the European Central Bank and Eesti Pank, the monetary policy outlook nevertheless points to relative stability.
Price growth slowed in the second quarter. In June, the annual growth in consumer prices was 2.3% (Q1 2026: 3.6%; Q2 2025: 4.8%), influenced mainly by cheaper food and a high comparison base, while energy carriers, in particular motor fuels, had the opposite effect. According to the June forecast of Eesti Pank, inflation will be approximately 3.4% in 2026 and price growth will remain close to 2.5% in the following years.
Based on the latest data from Statistics Estonia and our own assessment, the average gross wage grew by approximately 6.9% year-on-year in the second quarter, outpacing consumer price growth. A unified tax-free minimum, which came into effect at the beginning of 2026, plays a significant role in improving housing affordability, increasing the monthly net income and borrowing capacity of households.
Compared with the first quarter of 2026, the volume of new development sales offers in Tallinn remained at a similar level in the second quarter of 2026, while the average sales price grew moderately. According to Citify.eu, the average number of new apartment sales offers was 2,958 units (Q1 2026: 3,008 units; Q2 2025: 2,732 units), remaining nearly 8% higher year-on-year. The average price per square metre rose by 1.9% compared with the previous quarter (average for Q1 2026: EUR 5,129/m²; average for Q2 2026: EUR 5,227/m²) and was nearly 4.4% higher than a year earlier (Q2 2025: EUR 5,008/m²).
According to Citify.eu data, 379 sales contracts were signed in the second quarter, which is 14.8% fewer than in the previous quarter (Q1 2026: 445) but 3.8% more than in the same period last year (Q2 2025: 365). In contrast, a total of 239 apartments and terraced houses were sold in the areas surrounding Tallinn during the second quarter, which was 10.6% more than in the previous quarter (Q1 2026: 216) and 12.7% more than a year earlier (Q2 2025: 212), indicating a continued recovery in demand specifically outside Tallinn. Over the six months, a total of 824 sales contracts were signed in Tallinn, 13.7% more than in the same period last year (6 months 2025: 725). In the areas surrounding Tallinn, 455 apartments and terraced houses were sold in the first half of the year, exceeding the same period last year by 26.7% (6 months 2025: 359).
The stock of completed unsold apartments decreased during the second quarter to 797 apartments (31 March 2026: 916 apartments; 30 June 2025: 1,008 apartments), continuing the downward trend. Completed apartments accounted for an average of 27.6% of total supply in the second quarter (Q1 2026: 32.7%; Q2 2025: 36.3%), indicating a gradual decrease in the stock of completed homes on the market.
Outlook for the future
In the second half of 2026 as well, we expect households’ purchasing power to continue recovering and the interest rate environment to be relatively stable, although at a higher average level than in the first half of the year. General uncertainty in the market maintains a degree of caution, but we expect demand for new homes to hold up.
As at the end of the half-year, we have a total of 171 homes and a presale portfolio of EUR 48.6 million, of which EUR 39.8 million is in projects to be completed in 2026. Together with the EUR 11.4 million of revenue already earned in the first half of the year and new sales made at the beginning of the third quarter, nearly 90% of the 2026 revenue target of EUR 59 million has now been realised or covered by contracts, and the focus in achieving the target is shifting from sales activity to the completion and furnishing of buildings and the handover of homes.
Together with revenue growth, we also expect net profit to increase and to exceed the 20% return on equity target. Most of the year’s home handovers and the earning of revenue and profit will take place in the final quarter of the year. Due to our business model, the volume of construction loans is cyclical, peaking immediately before the completion of projects.
We continue working to secure growth in the coming years and are preparing to start construction of new projects and phases. In the second half of the year, we intend to start construction in a total of five different project phases, including the Kadakadabra project and the Juhkentali rental housing project, which will support the growth of our financial results in 2027 and lay the foundation for continued growth in 2028.
Homes already under construction in Peakorter phase I, the Luuslangi project and the Wohngarten project in Berlin will also be completed in 2027. We will likewise continue selling the remaining homes in previously completed projects. Revenue to be earned in 2028 and 2029 will also be significantly supported by the new properties acquired in the summer of 2026 and, subject to the expected successful completion of the planning procedure, by the Erika 12 property.
In acquiring new development projects in both Tallinn and Berlin, our attention has shifted to projects that will support our financial results in 2030 and the following years and allow us to grow both supply and revenue volumes steadily over the long term.
Our existing land portfolio enables us to grow volumes and profit in the coming years as well, and to keep return on equity above 20%.


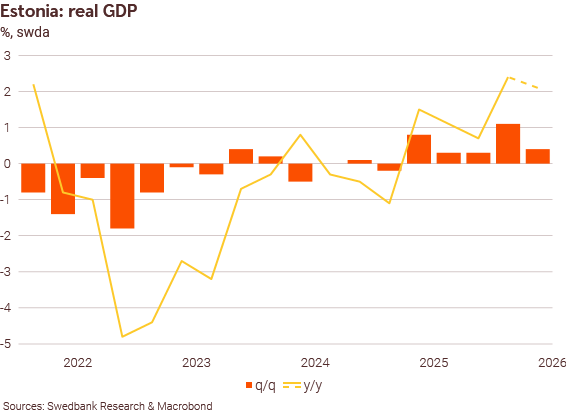
 Statistikaameti poolt kiirhinnanguna arvestatud tänavu teise kvartali SKP 2,1% kasv vastas meie ootustele. Samas tuleb arvestada, et see number võib hiljem tublisti muutuda. Näiteks on kiirhinnanguga leitud SKP muutus viimasel neljal aastal erinenud täpsustatud arvestusest keskmiselt 0,8 protsendipunkti. Lisaks toob augusti keskel avaldatav viimaste aastate SKP uuendus uue võrdlusbaasi ja võib kiirhinnanguga leitud majanduskasvu numbrit tavapärasest rohkem muuta.
 TEGEVJUHI ARUANNE: Rait Riim, Arco Vara AS, tegevjuht ja juhatuse liige:

 Fondijuhi kommentaar

 Kinnisvaraportaalis KV.EE
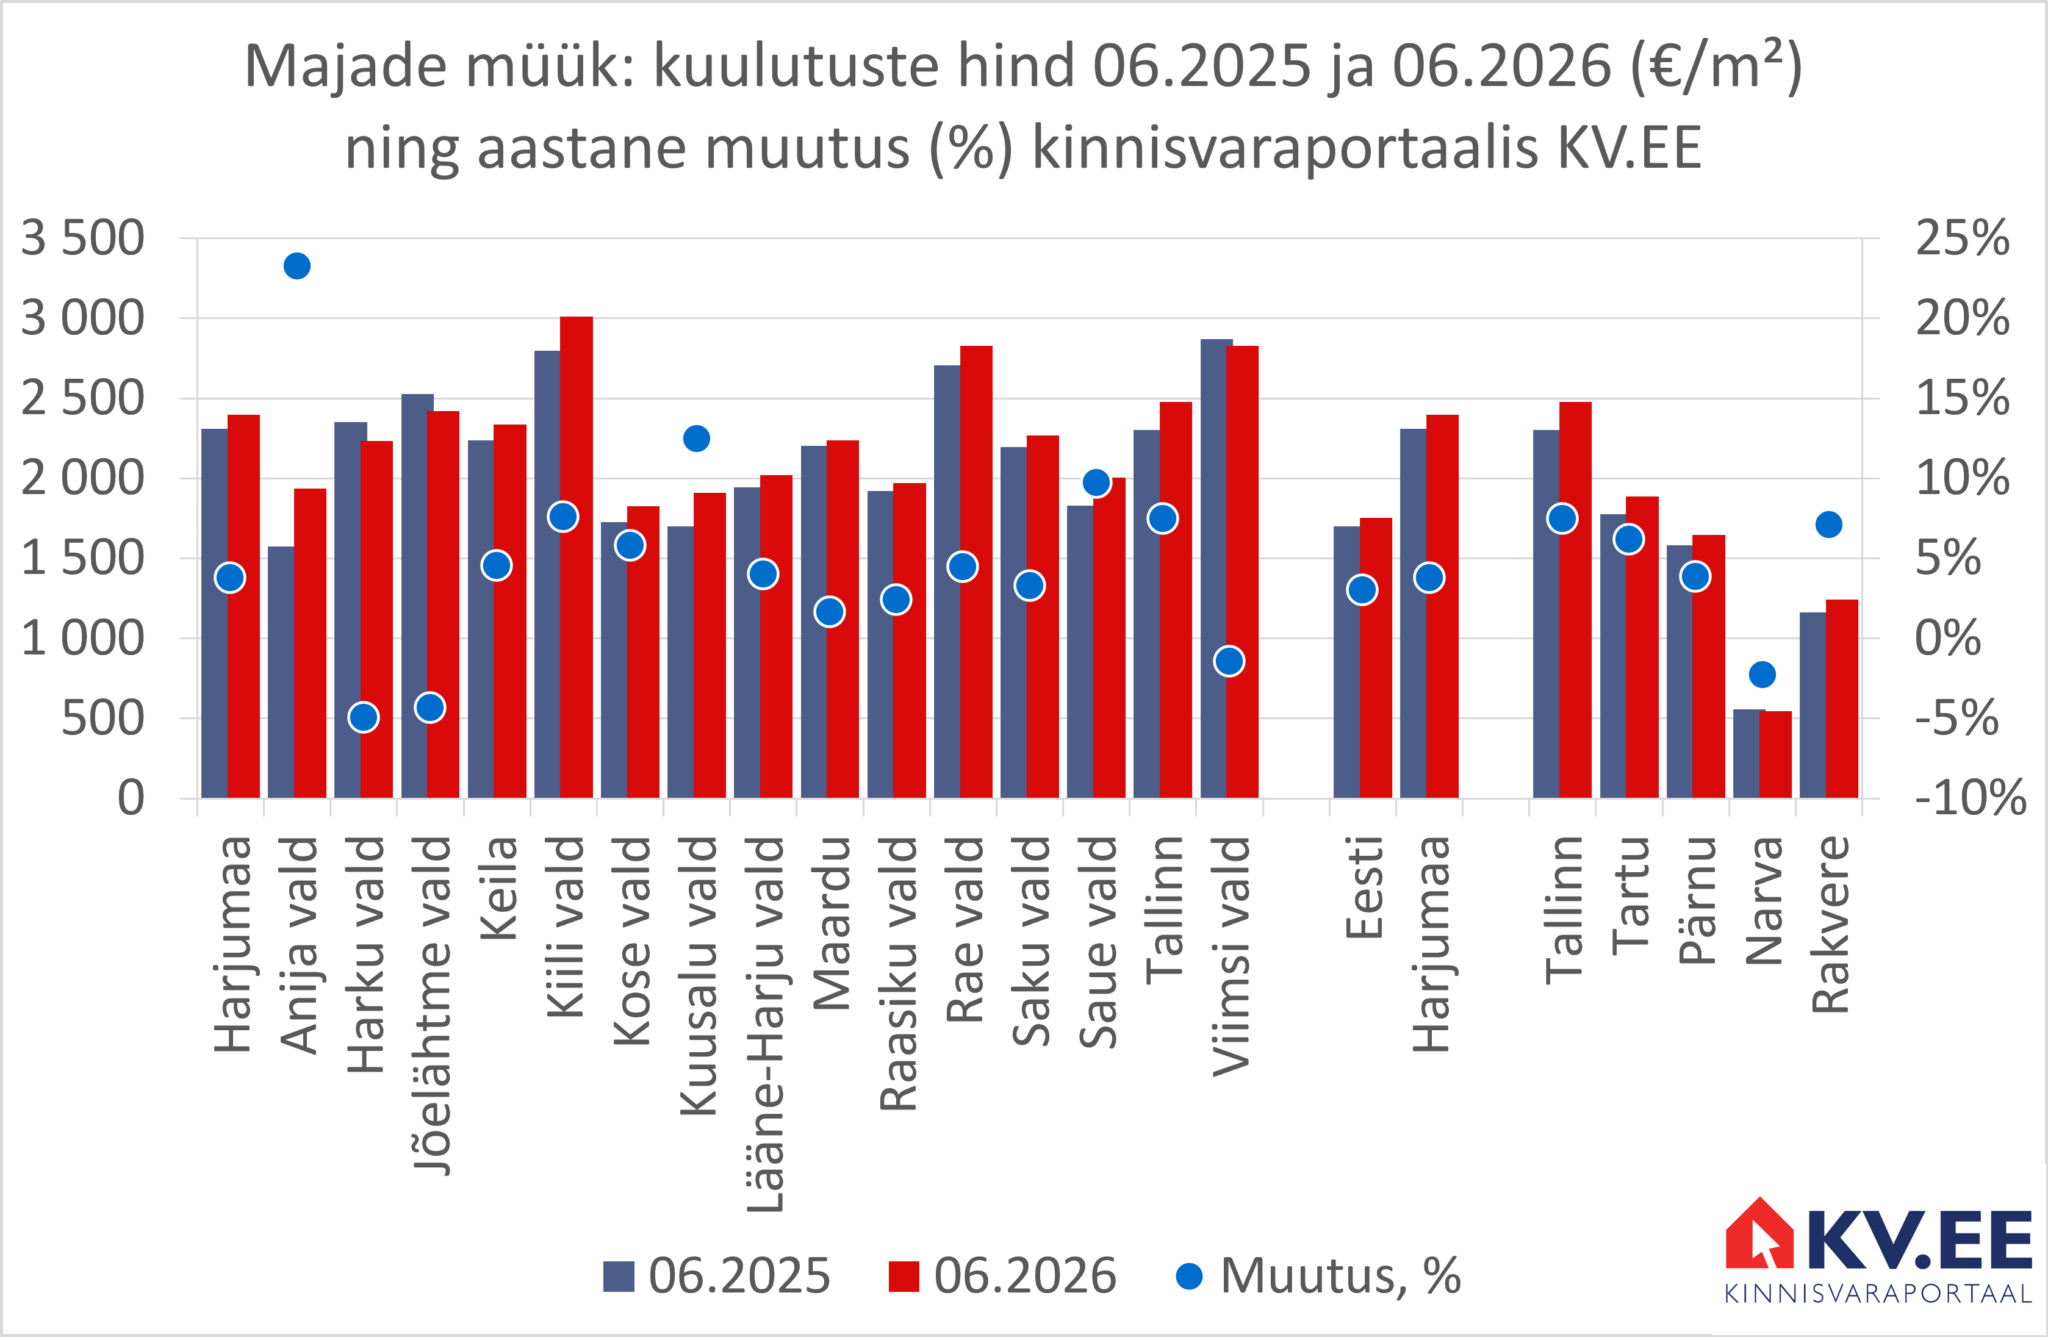


 Statistikaameti esialgsel hinnangul suurenes sisemajanduse koguprodukt (SKP) 2026. aasta teises kvartalis võrreldes eelmise aasta sama ajaga 2,1%.
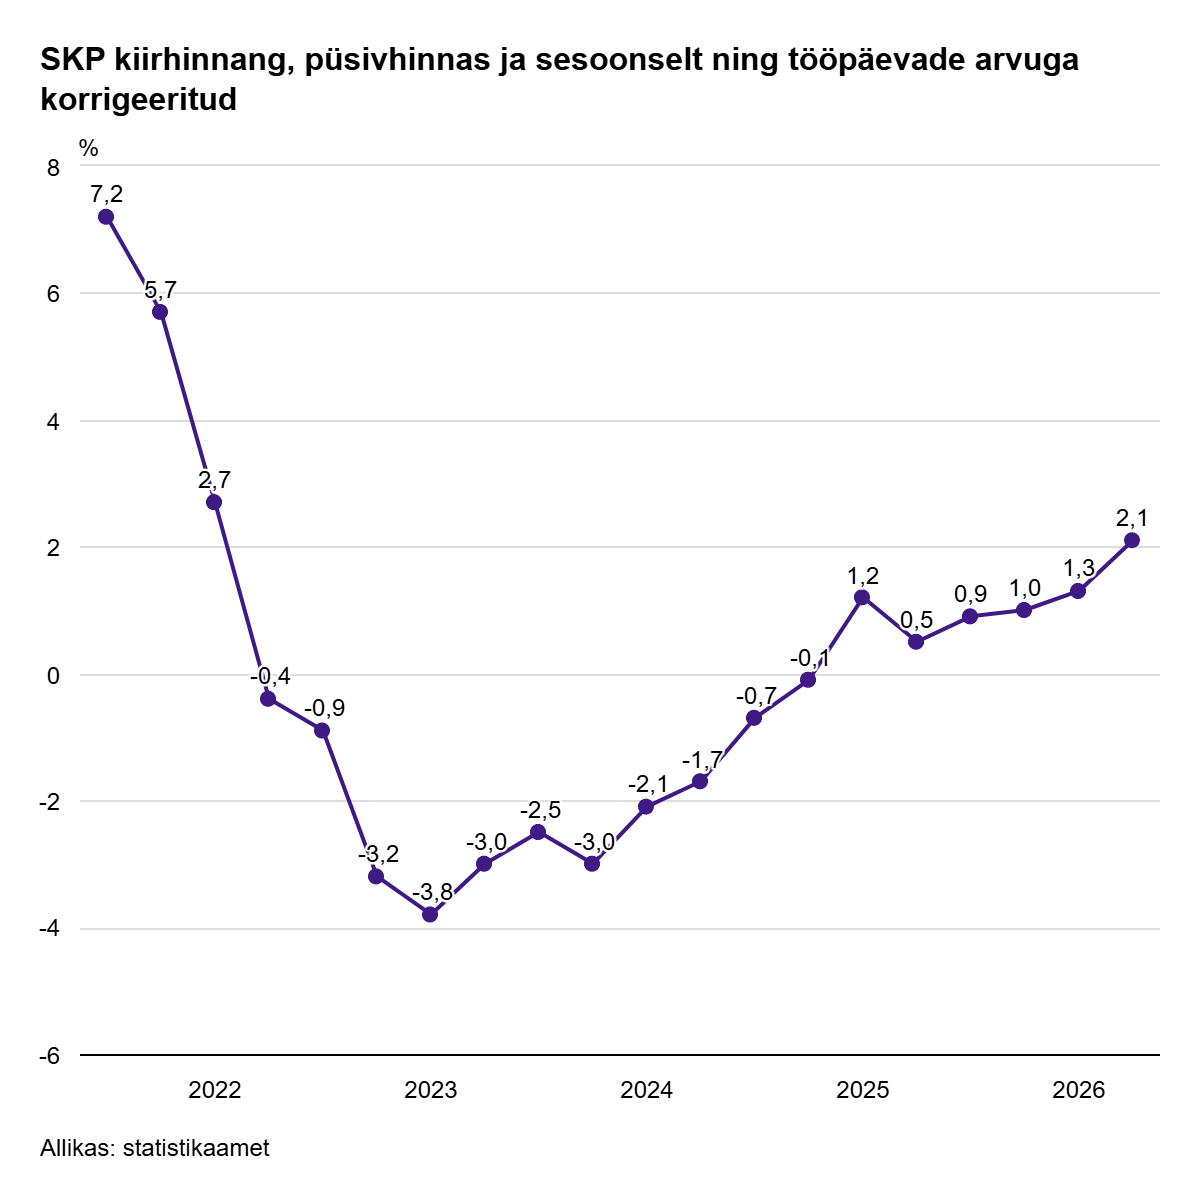

 Arco Vara AS müüs Tallinnas aadressil Helme 18 asuva padelikeskuse. Tehingu müügihind koos käibemaksuga oli 2,88 miljonit eurot, mis ületas vara bilansilist väärtust.

 2026. aasta esimene poolaasta kujunes kontserni arendusprojektide investeerimistsüklis üleminekuperioodiks, mida iseloomustas müügiks valmis korterite väike jääk, mis omakorda avaldas mõju ka aruandeperioodi finantstulemustele. Samal ajal jätkas kontsern uute arendusprojektide elluviimist ning sõlmis esimesel poolaastal 129 korteri esmamüügilepingut, mis on ligikaudu 40% rohkem kui aasta varem.